-
New Commercial Services Section
We have now opened a commercial services section here on the forum for registered users. If you have a Fabrik project that you wish to have someone work on for you, post it under Help Wanted. If you are an application developer and wish to earn some money helping others, post your details under Fabrik Application Developers.
Both of these are unmoderated. It will be up to both parties to work out the details and come to an agreement.
-
Joomla 5.1
For running J!5.1 you must https://fabrikar.com/forums/index.php?wiki/update-from-github/ or include the new file manually https://fabrikar.com/forums/index.php?threads/joomla-5-1-and-fabrik-cannot-find-files-error.54473/post-285151 See also Announcements
Timeline visualization
- Views Views: 16,412
- Last updated Last updated:
-
The timeline visualization plots records on a timeline (like a Gantt Chart). The top bar is a zoomed in view of the timeline, whilst the bottom bar is a zoomed out view of the timeline. Scrolling either will scroll the timeline.
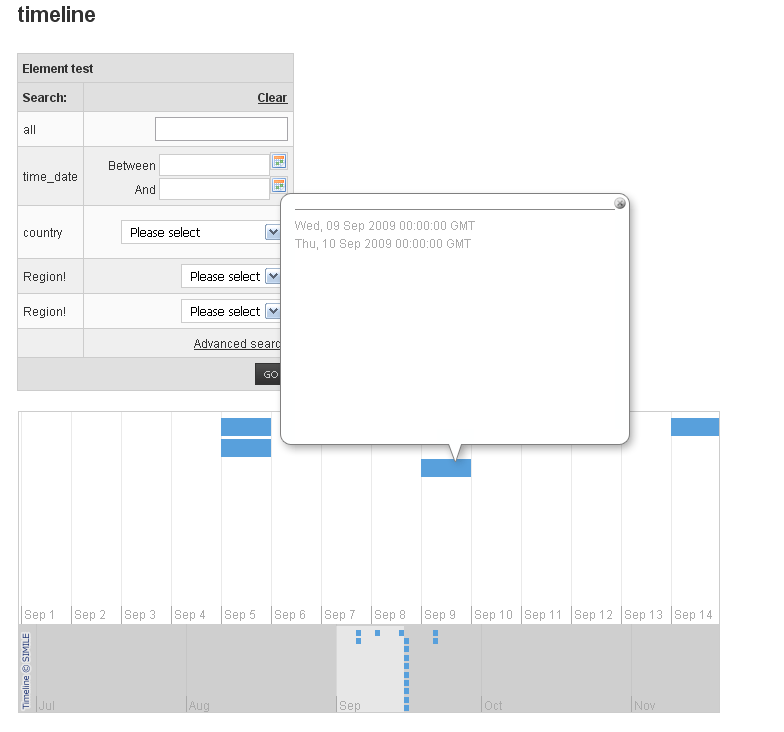
Each event is plotted on the page and can be clicked on to show further information about the event's record.
Data can be filtered, these settings are taken from the Elements found in the fabrik table's that are used to populate the timeline's data.
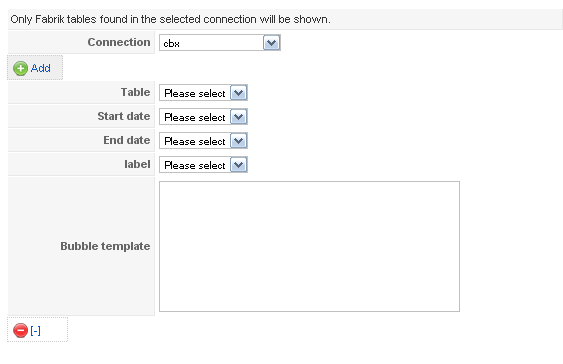
- Table - the fabrik table whose data will be plotted onto the timeline
- Start date - the element whose data contains the start date information. If selected date Elements don't have 'show time selector' activated then the timeline shows the event spanning the whole day
- End date - the element whose data contains the end date. If left blank then the event is presumed to last one day (if the start element's time Options are turned off) or to be a moment in time (if the start element's time Options are turned on)
- Label - The element whose data contains the event label
- Bubble template - This is the text that appears in a bubble when your users click on an event which has been plotted on the timeline. Use place holders (e.g. {tablename___elementname}) to include data from that event's record.