Nagtegaal
Member
Hi,
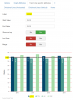
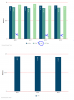
Anyone some experience with the visualization plugin FusionChart? I created a Multi-series 2D Column chart and try to built in a trendline, but I encountered some issues and I have some questions about formatting.
Anyone some experience with the visualization plugin FusionChart? I created a Multi-series 2D Column chart and try to built in a trendline, but I encountered some issues and I have some questions about formatting.
- In the backend I put as Legend 'Limiet' but the legend shows up as the first name of the element 'Arthur'
- If I do not fill in a End Value, no line shows up
- How can I change the color etc. of the trendline. I see the XML should be something like this
<trendlines>
<line color="#0075c2" tooltext="Limiet is 39:30" />
</trendlines>
But how to put this in Custom Attributes?